A look at food consumption trends and food expenditure in Rural and Urban India shows nutrition levels are still low in large swathes of India
To understand which class of society eats what, we turn to the NSSO survey on Household Consumption of Various Goods and Services in India 2011-12. The report separates per capita consumption into 12 divisions, called fractiles. Fractile 1 is the lowest 5% of the population in terms of consumption, fractile 2 is the next 5%, fractile 3 is the lowest 10-20%, fractile 4 the lowest 20-30% and so on. Fractile 12 is the top 5% of the population in terms of consumption, fractile 11 the 5% below it, fractile 10 the 80-90% group. In other words, the fractile classes used are the percentile classes 0-5%, 5-10%, 10-20%, 20-30%, 30-40%, ..., 70-80%, 80-90%, 90-95%, and 95-100%. These fractiles are taken separately for rural and urban India.

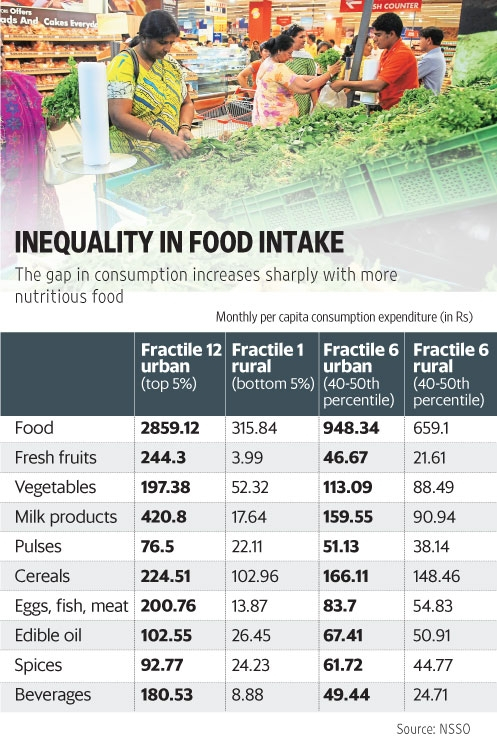
The survey shows the per capita monthly consumption of the various fractiles, or classes. The richest 5% of the urban population spent Rs2,859 per head per month on food in 2011-12, according to the survey, about nine times more than that spent by the bottom 5% of the rural population.
The rich don’t spend too much more on cereals—the top 5% in urban India, or fractile 12, spent about 2.2 times the amount spent by the poorest 5% of rural Indians on cereals. But go up the nutrition ladder and a very different picture emerges. The richest 5% spend around three-and-a-half times more on pulses than that spent by the poorest 5%. On vegetables, they spend around 3.8 times more. On eggs, fish and meat, the multiple is 14.5 times, on milk products 23.8 times. And on fresh fruits, which are obviously a luxury, they spend 61 times what the poorest 5% spend. The accompanying chart has the grim details.
But the bottom 5% of Indians is destitute. How does the picture change if we compare the 12th fractile of urban India, or the top 5%, with the 6th fractile, or the 40-50th percentile group in urban India, which is around the middle consumption level?
Well, here too there’s a big difference in food intake levels.
....